Build a Zero-Hallucination Upsell Narrative with Claude Skills
Tired of AI hallucinations? Discover how to combine dbt's semantic layer, the Model Context Protocol (MCP), and native Claude Skills to give your sales team instant, accurate product usage insights for upsell opportunities.
When an Account Executive is prepping for a QBR, or a Customer Success Manager is trying to spot churn, a dashboard is usually too slow. They don't want to filter through charts. They need a clear narrative about product usage: Is this account actually using what they pay for? Who are the internal product champions? Are they abandoning core features?
This isn't about summarizing Zendesk tickets or Salesforce notes. This is about giving your revenue team direct access to your product telemetry.
But if you just point an AI agent at your product data warehouse to answer these questions, it usually fails. It hallucinates because it’s guessing what "Active User" or "Churn Risk" actually means for your specific B2B SaaS.
I previously wrote about using "soft prompts" to guide Claude, but Anthropic recently released Claude Skills, a native way to give Claude specialized workflows.
Here is how I built a zero-hallucination, self-serve product analytics agent in 3 steps by combining dbt, Google MCP, and Claude Skills.
The Architecture: "Context as Code"
Most people try to fix AI hallucinations by writing giant system prompts. That’s fragile.
Instead, I push the definitions into the database schema itself. The AI reads your product metadata just like a human analyst would, and then uses a strict Claude Skill to format the output.
The Stack
- GrowthCues Core: My open-source dbt project that calculates product metrics from Segment/Rudderstack data and pushes definitions to BigQuery.
- BigQuery: Stores the product event data AND the metadata (column descriptions).
- Google MCP Toolbox: The secure bridge that allows Claude to query BigQuery directly from your machine.
- Claude Desktop: The conversational interface running the custom Skill.
- Claude Skill: A custom workflow that guides Claude to analyze product usage and generate a structured report.
Step 1: The Logic (Discover the Signal)
I use GrowthCues Core to build the semantic layer and product usage signal foundation. The secret isn't just the SQL; it's the schema.yml. Using dbt's persist_docs feature, I embed the exact business logic into the columns.
For example, here is how I define a volumetric product churn signal:
- name: fct_account_metrics_daily
  columns:
    - name: volume_change_ratio_7d
      description: >
        [Definition] Product Usage Contraction Signal.
        [Formula] (Sum of events last 7 days) / (Sum of events prior 7 days).
        [Context] < 1.0 means product usage is declining. < 0.5 is a strong churn risk.
When I run dbt run, these descriptions are written directly into the BigQuery metadata. The mathematical definition of Churn Risk lives inside the warehouse.
Step 2: The Architecture (Govern the Signal)
Next, I connect Claude Desktop to BigQuery using the Google MCP Toolbox. This provides Claude with specific tools like get_table_info and execute_sql.
I install the toolbox binary and update my claude_desktop_config.json file. You can find this file here:
- Mac:
~/Library/Application Support/Claude/claude_desktop_config.json - Windows:
%APPDATA%\Claude\claude_desktop_config.json
Here is the exact configuration I use:
{
  "mcpServers": {
    "bigquery": {
      "command": "/path/to/toolbox",
      "args": ["--prebuilt", "bigquery", "--stdio"],
      "env": {
        "BIGQUERY_PROJECT": "YOUR_PROJECT_ID"
      }
    }
  }
}
To let the MCP Toolbox use my Google user credentials, I authenticate via the Google Cloud CLI on my local machine:
gcloud auth application-default login
gcloud config set project YOUR_PROJECT_ID
Once authenticated, Claude has a secure, read-only bridge to my BigQuery project. It can now inspect schemas and execute product-level SQL locally.
Step 3: The Execution (Turn Signal into Action)
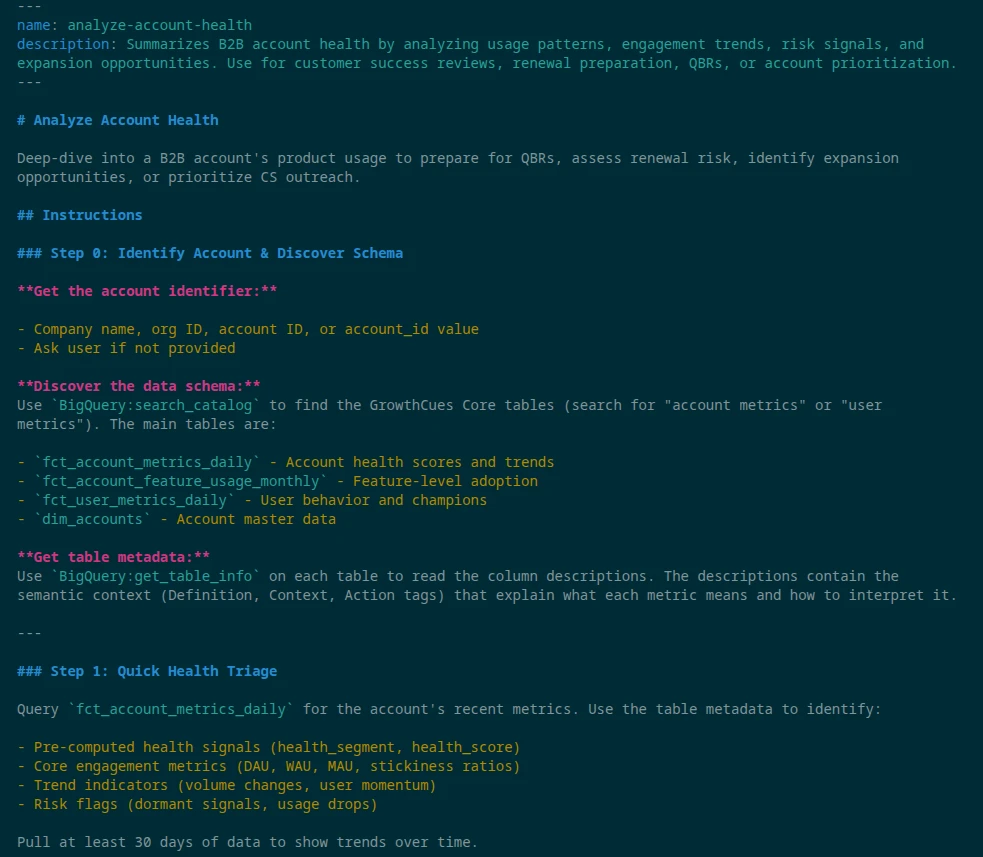
Instead of hoping Claude figures out what to do with the product data, I give it a strict operating procedure using a Claude Skill.
A Skill is just a folder containing a SKILL.md file with YAML frontmatter. I built an analyze-account-health skill that gives Claude a step-by-step playbook specifically for product usage. The Skill instructs Claude to read the metadata, run specific queries, and format the output in a structured way.
Deploying the Skill
- Ensure Code execution and file creation is enabled in Claude (Settings > Capabilities).
- Download my open-source skill folder and compress it into a ZIP file.
- In Claude, navigate to Customize > Skills.
- Click the "+" button, upload the ZIP file, and toggle the skill on.
The Payoff: A Self-Driving Product-Led Revenue Team
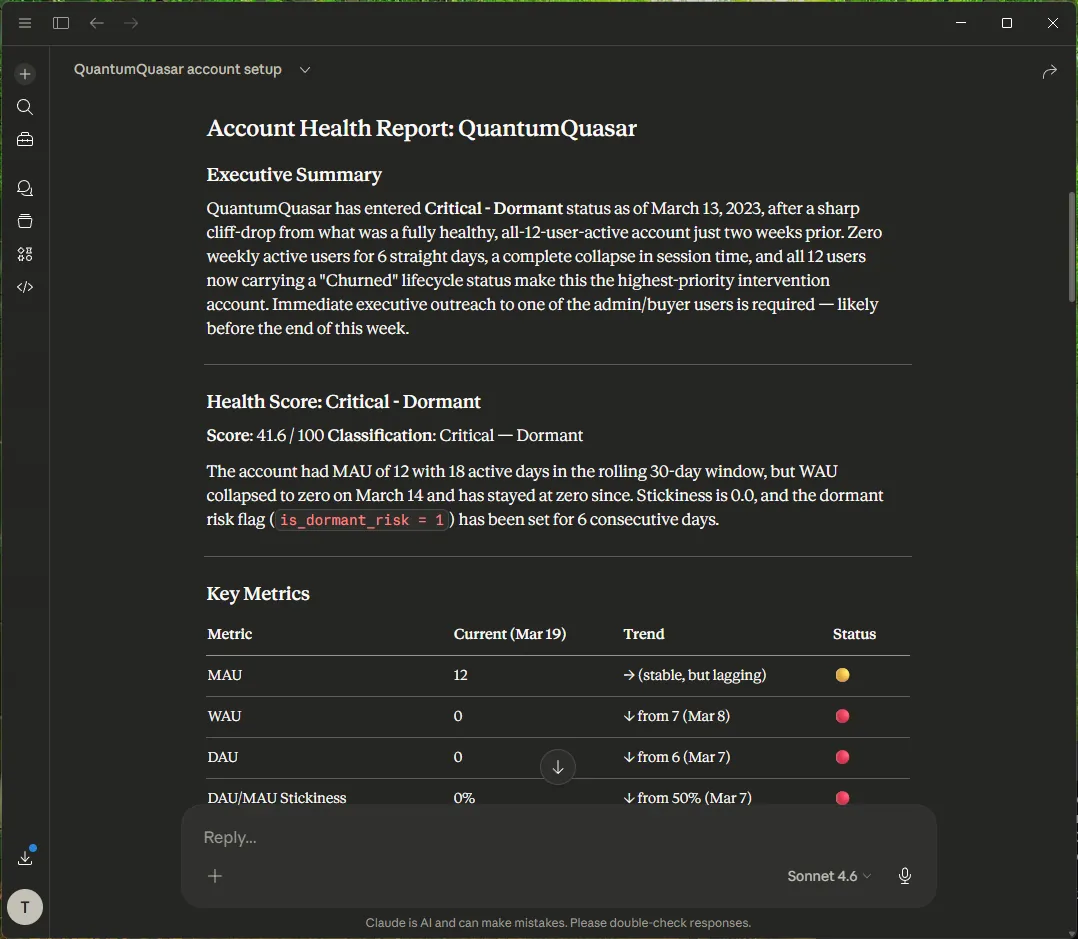
Now, a Customer Success Manager simply opens Claude Desktop and types:
/analyze-account-health QuantumQuasar
Claude automatically recognizes the command. It uses MCP to read the BigQuery metadata, understands your exact, mathematical definition of product churn, writes perfect SQL, and outputs a structured, QBR-ready report in seconds.
Your GTM team gets instant, reliable answers about product adoption, and your data engineers are finally free from the ad-hoc ticket queue.
The Uncomfortable Truth: AI Cannot Fix Bad Governance
This Claude workflow completely changes how sales and CS operate, but it carries a massive caveat: It only works if your underlying data model is causal and governed. If your product telemetry is messy, or if you are still relying on vanity metrics to guess at account health, the AI will simply generate hallucinated, confident reports faster. AI is a presentation layer; it cannot manufacture revenue signals out of broken architecture.
If your AEs are currently missing enterprise upgrades because your product and CRM data are disconnected, building a dashboard or an AI bot won't save you. You need to fix the engine.
I help B2B scaleups solve this through The Expansion Engine. It is a 4-week architectural sprint where I deploy a deterministic Two-Tier Expansion Index directly into your warehouse, permanently decoupling your revenue growth from your AE headcount.
Because I don't build predictive models on top of guesswork, we start with a strict safety valve:
- The €4,500 Diagnostic: During Week 1, I run a predictive backtest against your historical CRM and product data.
- The Guarantee: If my backtest cannot mathematically prove a baseline pipeline lift of at least 25%, the project stops. You keep the Revenue Expansion Blueprint, and you are never billed for the remaining engine build.
I am a bootstrapped solo founder and revenue architect. I do not sell open-ended retainers or slide decks; I deliver live capabilities your RevOps team can own on day one.
Get the free Claude Skill on GitHub to test the AI layer, or book a 15-minute alignment call. On that call, we will plug your numbers into a live Cost of Inaction (COI) calculation to see exactly how much enterprise expansion revenue your current data architecture is leaking today.
Put this guide into action
Download the PDF version for your team and take the next step with Arvoan.